2014
At the beginning of each year we determine what our data project will be for the year. A data project is something that we believe in and keep specific records on to show ourselves that we are making a difference in the counseling center. Our data project for the 2013-2014 school year was graduation numbers. We wanted to make a difference in the number of graduates we have at DYCH. We chose to focus on the Seniors who had been in our full-day K12 program. We chose this population because we felt we could make the most impact on these students. Our goal was to increase our total graduates by 10%. We are so excited by the results!
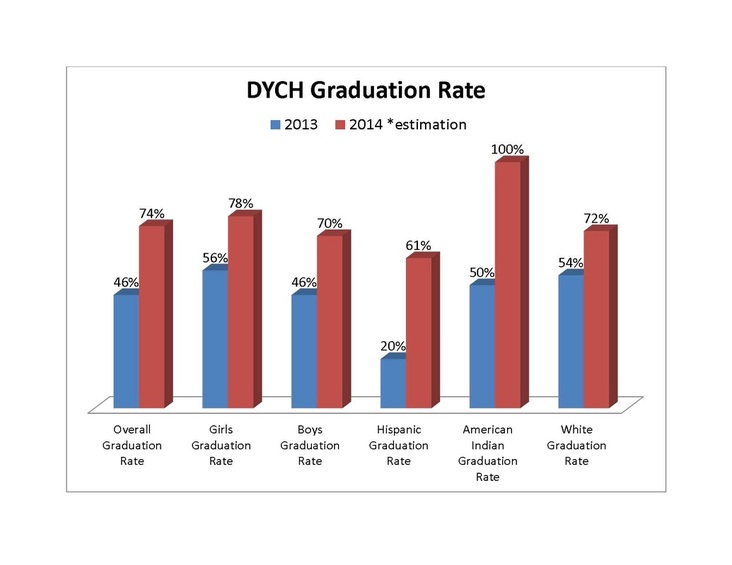
*data was taken before final numbers were calculated. Percentages were verified upon graduation.
Based on the interventions, we raised our overall graduation rate for the Seniors in our full-day K12 program from 46% to 74%! Our focus this year will be on increasing the boys graduation rate, with a special focus on the Hispanic population.
Based on the interventions, we raised our overall graduation rate for the Seniors in our full-day K12 program from 46% to 74%! Our focus this year will be on increasing the boys graduation rate, with a special focus on the Hispanic population.
2015
The 2014 data project showed the our most at-risk population of students is the boys, specifically Hispanic boys. In order to impact this population, for our 2015 data project we focused on a group of 11th grade boys who had struggled during the 10th grade year. The thinking was that in order to approach graduating on time, the 11th grade year was key. The intervention was a "Why Try" group, led by the Counselor, and individual meetings throughout the year to discuss progress and keep the boys motivated.
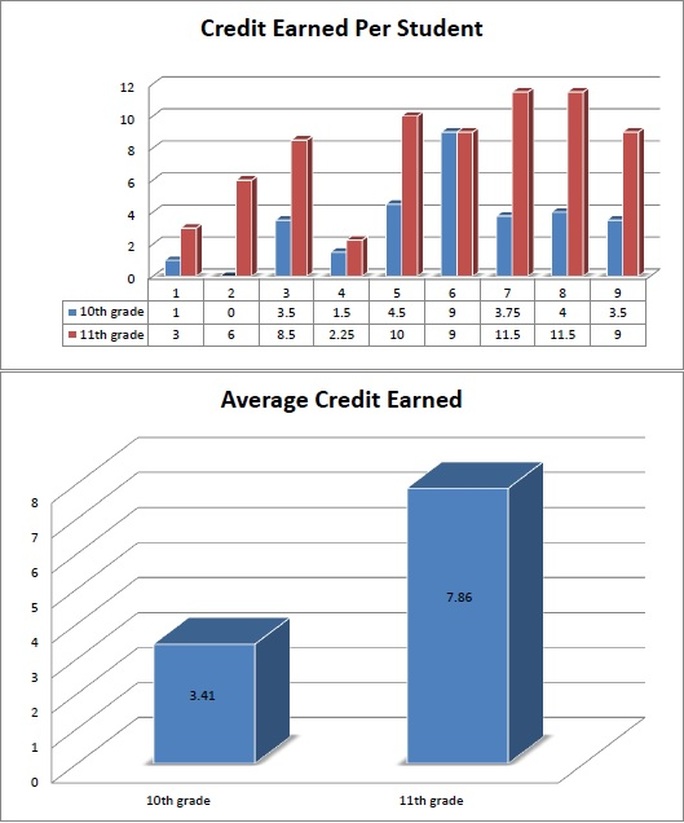
The interventions were successful in that we were able to raise the average number of credits earned for this population of students from 3.41 in 10th grade to 7.86 during 11th grade. We will continue these interventions to a larger population of at-risk students.
2016
As the purpose of our 2015 data project was to ultimately affect graduation, in 2016 we continued interventions with our male students to track graduation numbers. They had already participated in the "Why Try" group, so the intervention consisted of weekly check-in's with members of the Counseling Department to keep them on track.
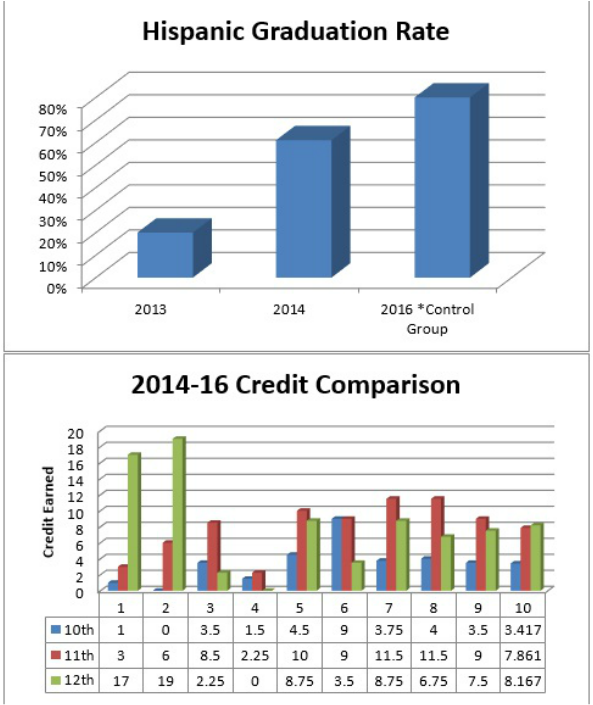
We were able to increase our Hispanic graduation rate from 61% in 2013 to 80% in 2016! The chart specifies control group, but that was actually the total number of Hispanic males enrolled. An interesting side note is that Hispanic males actually had a higher average of credits earned in 2016 than any other population in our school.
2017
During the 2017 school year we have focused on post high school aspirations. We want students to graduate with a goal in mind! We partnered with Utah State University who came in and taught in the English classes to try to raise ACT scores and post-high school preparation. The goal for our data project was that each student would be able to name a career of interest when asked. This may not seem like much, but at the student intake only 52% of the student could name a career they would be interested in. We want students to look to the future so they will have options.
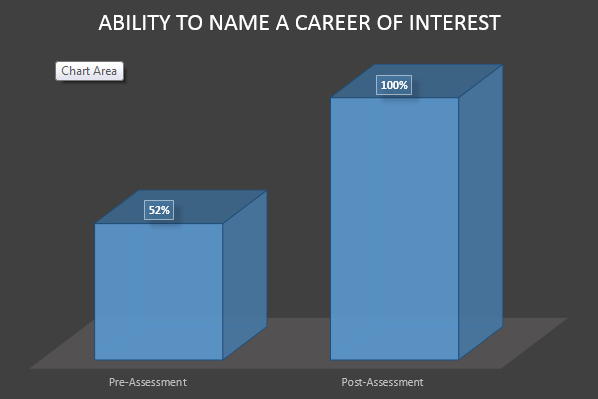
We met our goal! By the end of the year 100% of our students could name a career of interest. This was measured in multiple ways. The first measure was at the end of a lesson on careers where students found information on multiple careers of interest. They then picked one and did more research on it. The final measure was a conversation with the counselor where the students told her what they wanted to do after graduation.
